Laser Machine Buyers Guide: Evaluating Total Cost of Ownership
Evaluating laser machine cost requires moving beyond sticker price to model maintenance, energy, labor, and material waste. This framework helps buyers compare ownership economics across different models and production volumes.
- Sticker price is only a fraction of the long-term laser machine cost.
- Maintenance and energy consumption shift ownership economics based on duty cycle.
- Labor reduction and material utilization determine the payback period.
- A structured spreadsheet model beats a simple price comparison.
- Vendor-neutral documentation clarifies hidden costs before purchase.
Why Sticker Price Fails as a Comparison Metric
A laser machine cost analysis that stops at the purchase price misses the majority of ownership expenses. Capital equipment pricing varies by configuration, but the operating costs that follow for years depend on how the machine performs against your specific production profile. Two machines with identical list prices can generate very different total cost of ownership results if their maintenance intervals, energy draw, or material handling capabilities differ.
Buyers often default to the initial invoice because it is the only number presented in a sales sheet. That approach ignores the fact that the machine will consume electricity, require spare parts, demand operator attention, and influence material yield for the life of the asset. The goal of this framework is to force a comparison on the same operating basis, so that one model is not unfairly penalized or favored by hidden operational assumptions.
Core Components of a Realistic Ownership Model
The total cost of ownership for a laser system breaks down into four primary buckets. Capital cost includes the machine, installation, and any required facility upgrades. Operating cost covers electricity, gas if the system uses it, and consumable parts. Labor cost reflects the number of operators required, their training, and the time spent on setup and monitoring. Material cost captures the impact the machine has on yield, kerf width, and scrap rates.
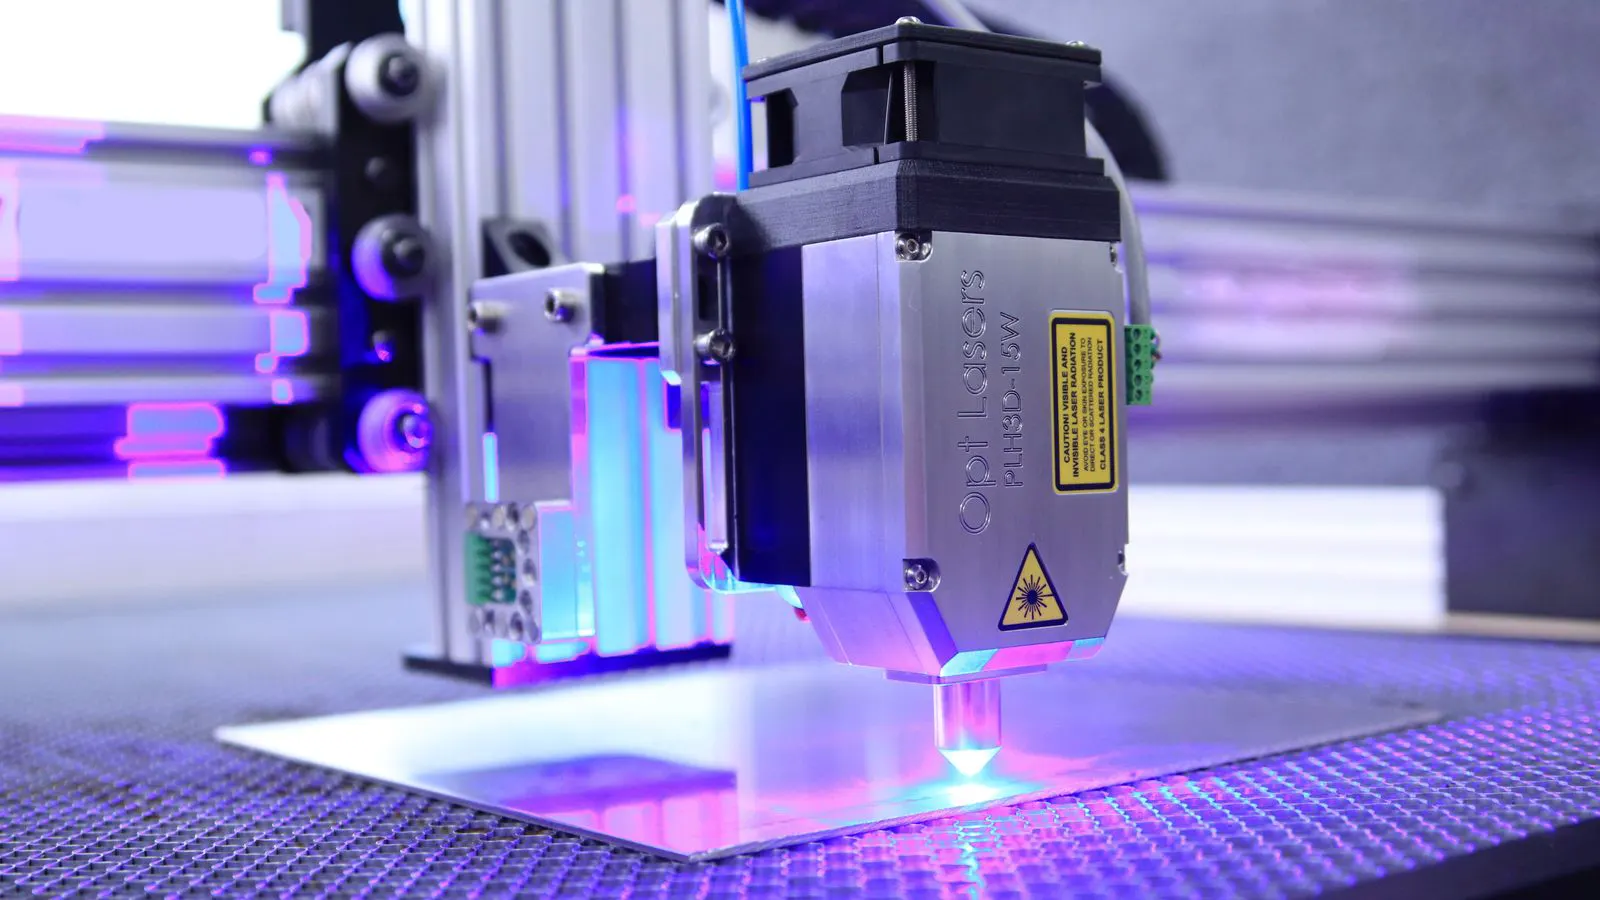
Each bucket behaves differently depending on the machine type and the material being cut. A CO2 fiber laser, for example, has a different energy profile and maintenance schedule than a CO2 glass laser or a diode-based unit. The fiber source typically has a lower thermal load and different optics replacement intervals. These differences change the annual cost structure even when the capital price is similar.
The Comparison Table
Using a standardized table forces buyers to assign weights to each cost category. The table below outlines the criteria that drive most ownership disputes in the industrial sector. It is not a ranking of machines but a checklist of questions to answer for every model under consideration.
| Criterion | What to look for | Why it matters |
|---|---|---|
| Maintenance Schedule | Intervals for head cleaning, lens replacement, and gas filtration | Unplanned downtime halts production and increases spare part inventory |
| Energy Consumption | Kilowatt draw during cutting versus idle states | High energy draw compounds over thousands of operating hours |
| Labor Requirement | Number of operators needed for setup and monitoring | Reduces labor cost but may require higher skill levels |
| Material Utilization | Kerf width and edge quality on target materials | Lower kerf and better edges increase material yield and reduce scrap |
| Software Flexibility | File compatibility and automation integration options | Reduces setup time and allows unattended production runs |
| Service Support | Response time and parts availability from the vendor | Affects uptime and the cost of emergency repairs |
Modeling the Annual Operating Cycle
To make the comparison actionable, you must translate these criteria into annual figures. Start by defining the expected annual operating hours. This is not the same as the annual production hours. A machine running 5,000 hours per year has a different cost profile than one running 3,000 hours, even if both are rated for the same duty cycle.
Next, estimate the cost per hour of energy. Multiply the average kilowatt draw during cutting by the number of cutting hours. Add the cost of gas if the system consumes it. This gives you a baseline operating cost. Then layer on maintenance. If the vendor recommends a head cleaning every 500 hours and a lens change every 2,000 hours, calculate the parts and labor cost for each event and annualize it.
The labor calculation is where many buyers make errors. They assume one operator can run two machines. In practice, setup, quality checks, and material loading require dedicated attention. If the machine requires a specialist to load the control panel, the labor cost per part increases. If it allows a basic operator to run a batch, the labor cost drops. The difference between these two scenarios can swing the total cost of ownership by a significant margin.
The Impact of Material Yield and Scrap
The laser machine cost is not just what the machine costs. It is also what the machine saves on materials. A narrow kerf reduces the amount of sheet metal or board consumed per part. If a machine cuts a 1mm kerf and another cuts a 1.5mm kerf, the material cost per part differs. This difference compounds over millions of parts.
Edge quality matters too. If the cut edge requires deburring or finishing, that adds labor time. If the edge is clean enough to go straight to the next operation, the process is faster. A machine that produces a clean edge on a difficult alloy may justify a higher capital price if it eliminates a finishing station.
Buyers should run a material cost test on their specific parts. Take a standard part and calculate the material cost using the kerf width of each candidate machine. Add the estimated finishing time. This creates a direct material and post-processing cost comparison that the sticker price cannot show.
Risk Factors and Hidden Costs
Not all costs are obvious. Facility upgrades can be a major hidden expense. If the machine requires a larger exhaust system or a different power capacity, the installation cost can exceed the machine price itself. Check the facility load before finalizing a purchase.
Warranty terms also hide risk. A standard warranty may cover parts but not labor. An extended warranty may cover both but with strict conditions. If a part fails outside the warranty period, the cost of a single head assembly or control board can be substantial. A machine with a longer service life and cheaper spare parts reduces this risk.
Vendor support is a cost factor, not just a service feature. If the vendor has a local service center, response time is shorter. If the vendor only has remote support, downtime extends. The cost of lost production during downtime is often higher than the cost of the repair itself.
Building the Decision Checklist
The final step is to synthesize the data into a decision. Use the following checklist to score each model before signing a purchase order.
- Capital Cost: Record the fully loaded price, including installation and facility upgrades.
- Annual Operating Cost: Sum the energy, gas, and consumable parts for the expected operating hours.
- Annual Labor Cost: Calculate the operator hours required for setup, monitoring, and quality checks.
- Material Cost Impact: Compare the material cost per part using the specific kerf width and edge quality of each model.
- Risk Assessment: Evaluate warranty terms, parts availability, and vendor support response times.
- Sensitivity Analysis: Run the model at 80% and 100% of expected production volume to see how the payback period changes.
Do not rely on a single number. Look at the range. A machine that costs more upfront but has a lower material cost and faster setup time may pay back faster than a cheaper machine with higher operating costs.
Conclusion
Evaluating laser machine cost requires a disciplined approach to data collection and modeling. The sticker price is the starting point, not the answer. By breaking down the total cost of ownership into capital, operating, labor, and material components, buyers can compare models on a fair basis. The model must reflect the specific production volume, material types, and facility conditions of the plant.
Use the comparison table to identify the criteria that matter most for your operation. Assign weights based on your production profile. Build the annual operating cycle with realistic energy and maintenance figures. Test the material yield on your actual parts. Finally, apply the decision checklist to score each model.
The result is a clear, data-driven comparison that aligns the purchase with the long-term economics of the plant. This method reduces the risk of a poor financial decision and ensures that the chosen machine supports the operational goals of the business.
Frequently asked questions
How long should I plan for the total cost of ownership?
Most industrial laser machines have a useful life of ten to fifteen years. Planning for ten years is a standard baseline for financial modeling.
Can I use the same model for different materials?
Yes, but the cost per part will vary. Fiber lasers perform differently on steel than on non-ferrous metals. Adjust the material cost and maintenance assumptions for each material type.
What is the biggest hidden cost in laser ownership?
Facility upgrades are a common hidden cost. Exhaust, power, and floor space requirements can add significant capital expenses that are not included in the machine price.
How does automation change the labor cost calculation?
Automation reduces the number of operators needed for loading and monitoring. It can lower the labor cost per part but may increase the capital cost of the machine.
Should I include the cost of training in the total cost of ownership?
Yes. Training operators on a new machine takes time and labor. Include the cost of the training program and the lost production during the learning curve.